MeltDBWiki/DatabaseSearch: Difference between revisions
Jump to navigation
Jump to search
imported>HeikoNeuweger No edit summary |
imported>HeikoNeuweger No edit summary |
||
| Line 4: | Line 4: | ||
== Perform preprocessing methods using MeltDB: [[DatabaseSearch]] == | == Perform preprocessing methods using MeltDB: [[DatabaseSearch]] == | ||
* After logging in to MeltDB, navigate to your experiment or chromatogram. | * After logging in to MeltDB, navigate to your experiment or chromatogram. Make sure that peaks have already been predicted for your datasets. | ||
* Select 'Run Analysis' from the list of possible actions. | * Select 'Run Analysis' from the list of possible actions. | ||
[[Image:MeltDBWiki$$DatabaseSearch$runtool1.png]] | [[Image:MeltDBWiki$$DatabaseSearch$runtool1.png]] | ||
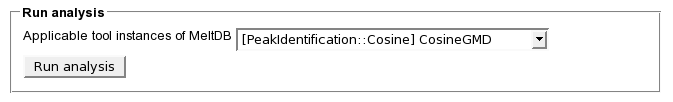
* A list of applicable tools defined in your MeltDB project is presented. Select CosineGMD mass | * A list of applicable tools defined in your MeltDB project is presented. Select e.g. the 'CosineGMD' tool to perform a mass spectral search in the public Golm Metabolite Database. The database contains GC/MS mass spectra together with textual descriptions of the measured substances. For several mass spectra in the GMD the Retention Indices according to Kovat's method are given. Hit the 'Submit Job' button. | ||
[[Image:MeltDBWiki$$DatabaseSearch$runtool2.png]] | [[Image:MeltDBWiki$$DatabaseSearch$runtool2.png]] | ||
| Line 23: | Line 23: | ||
[[Image:MeltDBWiki$$DatabaseSearch$jobstatus3.png]] | [[Image:MeltDBWiki$$DatabaseSearch$jobstatus3.png]] | ||
* After the computation is finished, use e.g. the 'Show TIC' or 'Show 2D' action to | * After the computation is finished, use e.g. the 'Show TIC' or 'Show 2D' action to navigate to the detected peaks in your chromatograms. MeltDB creates Observations for each peak having a mass spectrum which matches entries in the Golm Metabolite database. The closer the score is to 1.0, the more similiar are the mass spectra. According to the configuration of the CosineGMD tool, several matches may be stored in MeltDB and have been associated to the individual peaks. | ||
Revision as of 20:33, 2 March 2009
Perform preprocessing methods using MeltDB: DatabaseSearch
- After logging in to MeltDB, navigate to your experiment or chromatogram. Make sure that peaks have already been predicted for your datasets.
- Select 'Run Analysis' from the list of possible actions.

- A list of applicable tools defined in your MeltDB project is presented. Select e.g. the 'CosineGMD' tool to perform a mass spectral search in the public Golm Metabolite Database. The database contains GC/MS mass spectra together with textual descriptions of the measured substances. For several mass spectra in the GMD the Retention Indices according to Kovat's method are given. Hit the 'Submit Job' button.

- The job is submitted to a compute cluster and you can observe its progress via the 'Show job status' dialog.
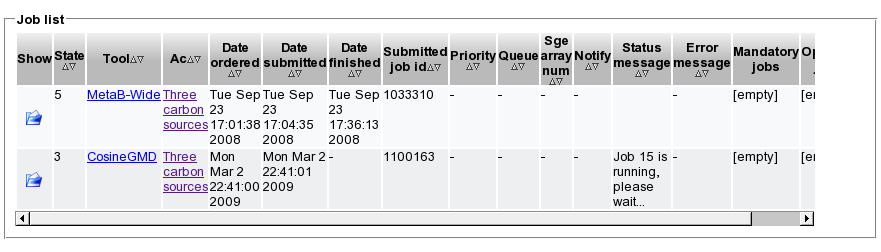

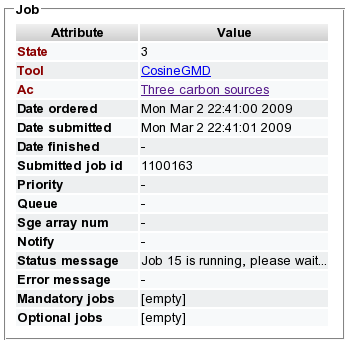
- Open the respective job from the list and review the state of the computation. State 5 represents finished jobs, state 3 represents running and state 6 represents failed jobs. A message regarding the current status provides additional information.

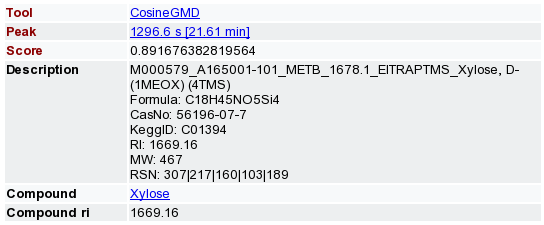

- After the computation is finished, use e.g. the 'Show TIC' or 'Show 2D' action to navigate to the detected peaks in your chromatograms. MeltDB creates Observations for each peak having a mass spectrum which matches entries in the Golm Metabolite database. The closer the score is to 1.0, the more similiar are the mass spectra. According to the configuration of the CosineGMD tool, several matches may be stored in MeltDB and have been associated to the individual peaks.