EMMAWiki/WebDocumentation/HowTos/DatasetBrowserHowTo
Browse DataSets
This Section describes the use of the Dataset Browser. A description of shared terms can be found in HelpSystem.
This Howto is divided in 2 subsections (chronological by menu prompt):
Select Dataset(s)
The following image shows the dialog with three examples of a raw datasets of a current experiment. Each dataset has an unique Identifier, a self explaining Name and if available a short description. The Cube-Order, #BA-Dim,. #DE-Dim and #QT-Dim gives you information about the size and range of the dataset:
- Cube-Order: lay down the following order but is at current state always BDQ,
- #BA-Dim: show how many arrays were used from this dataset and is also at current state always one,
- #DE-Dim: stands for the number of rows. Shows how many Designelements were used.
- #QT-Dim: stands for the number of columns. Shows how many Quantitationtypes were used.
The Quality is an index for the user. It ranges from very good to insufficient.

Show
Clicking the Show All button shows the selected dataset(s) in one table as described in View Dataset(s).
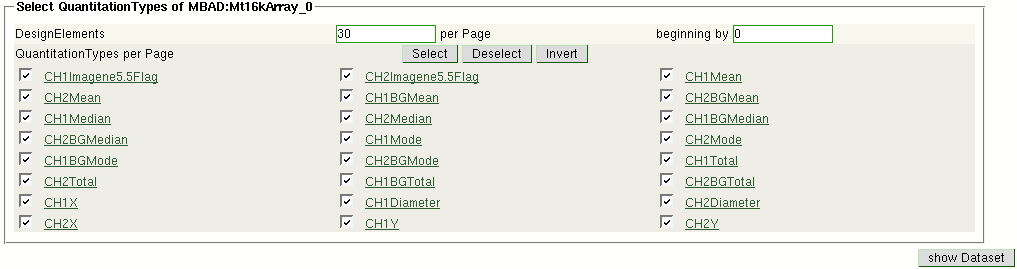
Coincid QuantitationType-Selection
The Common Label/Column Selection button let you take a preselection of Quantitationtypes which leads to the dialog box (shown below). Thus you can decide which Quantitationtype should be shown for all selected datasets at once. You can get more information about each Quantitationtype by following the link.

Remarks:
- QuantitationType-Selection currently works only for data display. The exported datasets always contain the full tables.
Individual QuantitationType-Selection
 A more sensitive preselection can be made if you click the Individual Label/Column Selection button. Here you can select which Quantitationtype you want for each
 dataset. The dialog box is almost the same as the one shown above and includes all selected datasets.
Remarks:
- QuantitationType-Selection currently works only for data display. The exported datasets always contain the full tables.
View Dataset(s)
The datasets are shown as one table which can be browsed easily with the navigation bar. Each DesignElement and Quantitationtype is linked for further detailed information.


Data Display
The actual data is displayed in the table cells. The number format is normally chosen automatically depending on the actual values.
Default is to use floating point representation with eg 12.8032050412329 with a maximum of 15 digits. For very large numbers or numbers close to zero, exponential representation will be used, like 1.2E10 = 1.2 * 1010 or 1.2E-10 = 1.2 * 10-10.
Remarks:
- . (dot) is used as decimal character, not , (comma) for display and export
- The internal precision of the data might be higher than the display precision.
- The number of decimal digits depends on the value, the maximal number of total digits is 15.
- NaN means Not a Number. It represents a missing or infinite value. Often, values are set to NaN by filter procedures.
- NaN are also found in one-sample statistical tests, for values for the second group. This means, that their calculation is not applicable.
Dimension Range
The first section of this window is for specifying how many rows (DesignElement) are shown in each page. Entering a start and end position in the Dimension-Range field enables you to go to the given position. With this option you can also set the number of Designelements per page. The field named Search offers you a simple possibility to restrict the Designelements by the Identifier.
Sort by Quantitationtypes
 The blue arrows in the first row of the table let you sort the dataset in ascendending or descendending order. Also you can choose between sorting the current shown page or the whole
 dataset(s) by switching the radio button above the table between Sort only this page or Sort whole dataset. If you pick the option whole dataset the
 assortion remains while browsing the dataset until you click Drop Assortment.
Filter Data
 The button filter data opens a new window where you are able to filter the dataset. Start to single out the whished Quantitationtype in the first drop-down menu then
 select an operator and leave the value for the comparison in the right text field. If you want to filter for more than one Quantitationtype or one Quantitationtype with
 different  operation you have to chose AND at the first drop-down menu of each next line you want to include. The More button leads in as many new lines you want.
 As by the sorting the filter keeps by as long until Drop Assortment. You can reactivate the sorting/filtering by pressing the Keep Assortment button. This way
 you switch between the raw dataset and your last performed sorting/filtering.
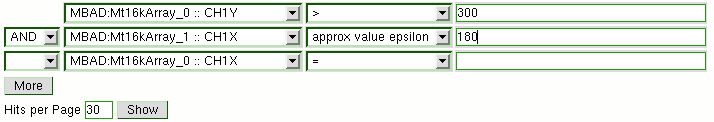

The following operators available:
- > : greater
- < : less than
- >=: greater or equal
- <= : less or equal
- != : not equal
- approx value epsilon : get all values approximately equal to value within an range of +/-epsilon (default 0.001). e.g.:
approx 10 0.1 will return all rows where the selected column value is between 9.9 and 10.1
- not missing : filter rows where selected column has a good value (not NaN)
- missing : the opposite, return all rows with missing values
Export
It is possible to download the dataset as a tab seperated text file. You can either export the foltered/sorted dataset ore the whole dataset.