MeltDBWiki/Profiling
Profiling in MeltDB
- You have already uploaded your chromatograms and organized them into Chromatogram Groups and an Experiment
- Open your experiment
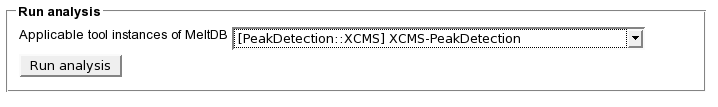
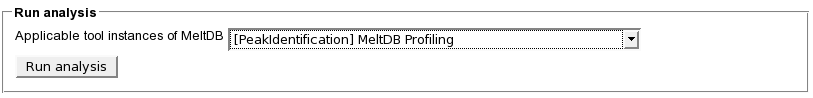
- Next step is to perform a XCMS based peak detection. Select 'Run analysis' in the experiment context

- Select one of the XCMS based peak detection tools and start the analysis

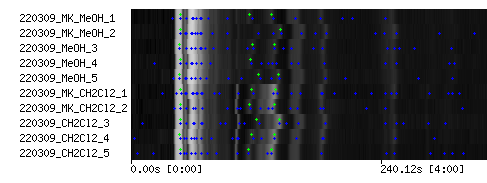
- After the XCMS peak detection job has been submitted to the compute cluster and finished, review the results using the 'Show TIC' action of your experiment.
- Select one chromatogram that features at least 30 peaks and does not contain artifacts and to much saturated peaks

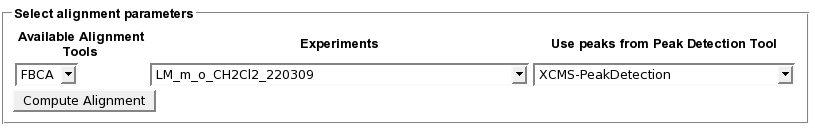
- For this chromatogram, compute the FBCA based alignments using the 'Compute alignment' action.

- Select FBCA, your current experiment and the XCMS peak detection tool you just applied

- Depending on the number of chromatograms in your experiment this may take a while
- Navigate back to your experiment and run the 'MeltDB Profiling' tool via the 'Run analysis' action

- The MeltDB profiling tool iterates through all peaks in the selected reference chromatogram. Matching peaks in the aligned chromatograms are detected using mass spectral similarity (cosine score) and chromatographic proximity. If a common EIC peak can be detected in more than 80 % of the chromatograms, a mass spectral tag is annotated using the median retention time and the m/z value of the most abundant common EIC.
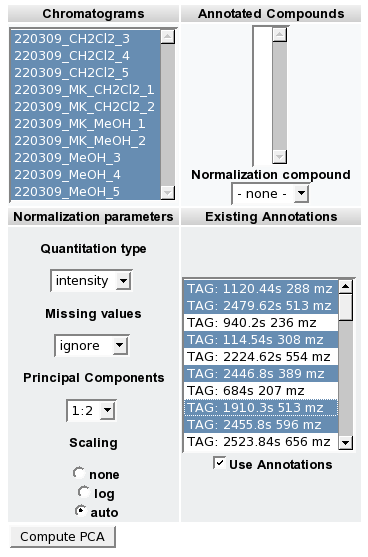
- Review the detected Mass Spectral tags in the TIC view of your experiment (green peak markers)
- You are now able to perform statistical and exploratory analysis (Boxplot, ICA, PCA, etc) on the detected Tags.