MeltDBWiki/PeakDetection: Difference between revisions
Jump to navigation
Jump to search
imported>HeikoNeuweger No edit summary |
m (3 revisions) |
||
| (2 intermediate revisions by one other user not shown) | |||
| Line 9: | Line 9: | ||
[[Image:MeltDBWiki$$PeakDetection$runtool1.png]] | [[Image:MeltDBWiki$$PeakDetection$runtool1.png]] | ||
* A list of applicable tools defined in your MeltDB project is presented. Select e.g. | * A list of applicable tools defined in your MeltDB project is presented. Select e.g. XCMS for a TIC based peak detection and click 'Run analysis'. | ||
* The job is submitted to a compute cluster and you can observe its progress via the 'Show job status' dialog. | * The job is submitted to a compute cluster and you can observe its progress via the 'Show job status' dialog. | ||
| Line 19: | Line 16: | ||
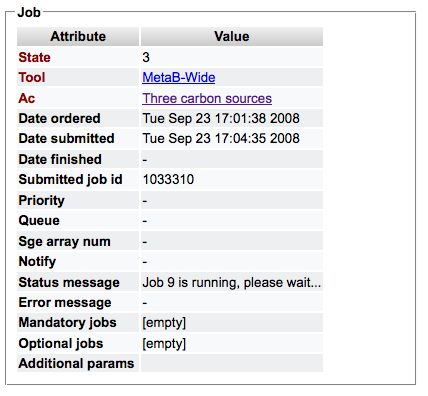
* Open the respective job from the list and review the state of the computation. State 5 represents finished jobs, state 3 represents running and state 6 represents failed jobs. A message regarding the current status provides additional information. | * Open the respective job from the list and review the state of the computation. State 5 represents finished jobs, state 3 represents running and state 6 represents failed jobs. A message regarding the current status provides additional information. | ||
[[Image:MeltDBWiki$$PeakDetection$ | [[Image:MeltDBWiki$$PeakDetection$jobstatus2.png]] | ||
[[Image:MeltDBWiki$$PeakDetection$jobstatus3.png]] | |||
* After the computation is finished, use e.g. the 'Show TIC' or 'Show 2D' action to review the computed peaks. MeltDB creates Peaks and Observations with the respective area and intensity for all results of the peak detection tool. | * After the computation is finished, use e.g. the 'Show TIC' or 'Show 2D' action to review the computed peaks. MeltDB creates Peaks and Observations with the respective area and intensity for all results of the peak detection tool. | ||
Latest revision as of 07:16, 26 October 2011
Perform preprocessing methods using MeltDB: PeakDetection
- After logging in to MeltDB, navigate to your experiment or chromatogram.
- Select 'Run Analysis' from the list of possible actions.
- A list of applicable tools defined in your MeltDB project is presented. Select e.g. XCMS for a TIC based peak detection and click 'Run analysis'.
- The job is submitted to a compute cluster and you can observe its progress via the 'Show job status' dialog.
- Open the respective job from the list and review the state of the computation. State 5 represents finished jobs, state 3 represents running and state 6 represents failed jobs. A message regarding the current status provides additional information.
- After the computation is finished, use e.g. the 'Show TIC' or 'Show 2D' action to review the computed peaks. MeltDB creates Peaks and Observations with the respective area and intensity for all results of the peak detection tool.

