GenDBWiki/WebDocumentation/MainViews/KEGGView: Difference between revisions
Jump to navigation
Jump to search
No edit summary |
No edit summary |
||
| Line 3: | Line 3: | ||
[[File:KEGG-Browser.png|KEGG Browser]] | [[File:KEGG-Browser.png|KEGG Browser]] | ||
{| | {| border="1" cellpadding="5" | ||
| 1 || search EC numbers || Enter an EC number in the field provided and hit search to search for pathways containing this enzyme. The pathways found will be listet in the pathway browser (3). The number of occurrences in each pathway is given in brackets following the pathway name. | | 1 || search EC numbers || Enter an EC number in the field provided and hit search to search for pathways containing this enzyme. The pathways found will be listet in the pathway browser (3). The number of occurrences in each pathway is given in brackets following the pathway name. | ||
|- | |- | ||
Latest revision as of 21:44, 11 November 2011
The GenDB web KEGG view
| 1 | search EC numbers | Enter an EC number in the field provided and hit search to search for pathways containing this enzyme. The pathways found will be listet in the pathway browser (3). The number of occurrences in each pathway is given in brackets following the pathway name. |
| 2 | view expression data | Press the browse button to search in your local directory tree for your own file containing expression data. Then hit upload to map the given expression values onto the currently displayed KEGG map. |
| 3 | pathway browser | Shows all KEGG pathways currently in our database. For each pathway the number in brackets denotes the number of occurrences of the EC number after searching. See (1). |
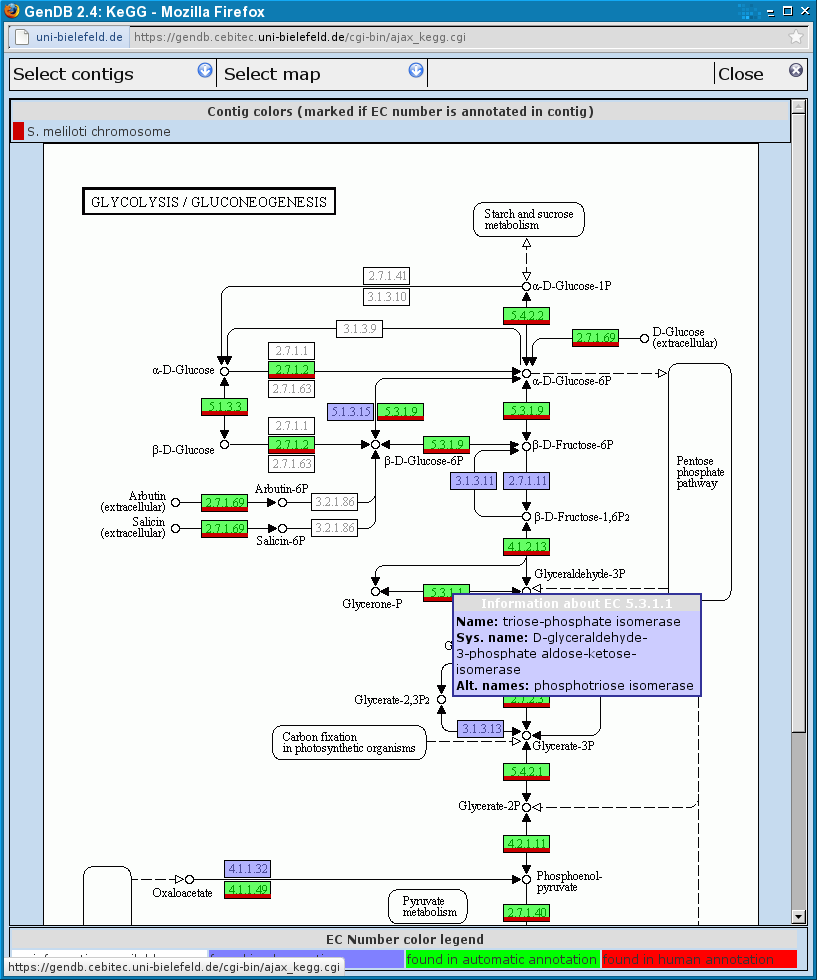
| 4 | KEGG map viewer | Here the KEGG map corresponding to the selected pathway in the pathway browser (3) is shown. All enzymes that are annotated in the genome currently loaded into GenDB are highlighted in green (depending on the annotator?). |
| 5 | enzyme information | After clicking on an enzyme in the KEGG map (4) corresponding genomic information is given in this section. If the corresponding enzyme was annotated automatically its background is green, in case of human annotation the background color is red, and it is dark blue if there only is an observation. By clicking on the Name... By clicking on one of the Actions new windows will popup to enable annotating the region, showing observations or a report about the region. |
| 6 | highlight / annotate | Something happens if you click one of these buttons. |
