GenDBWiki/WebDocumentation/DialogWindows/Virtual2DGel
Jump to navigation
Jump to search
Virtual2D-Gel
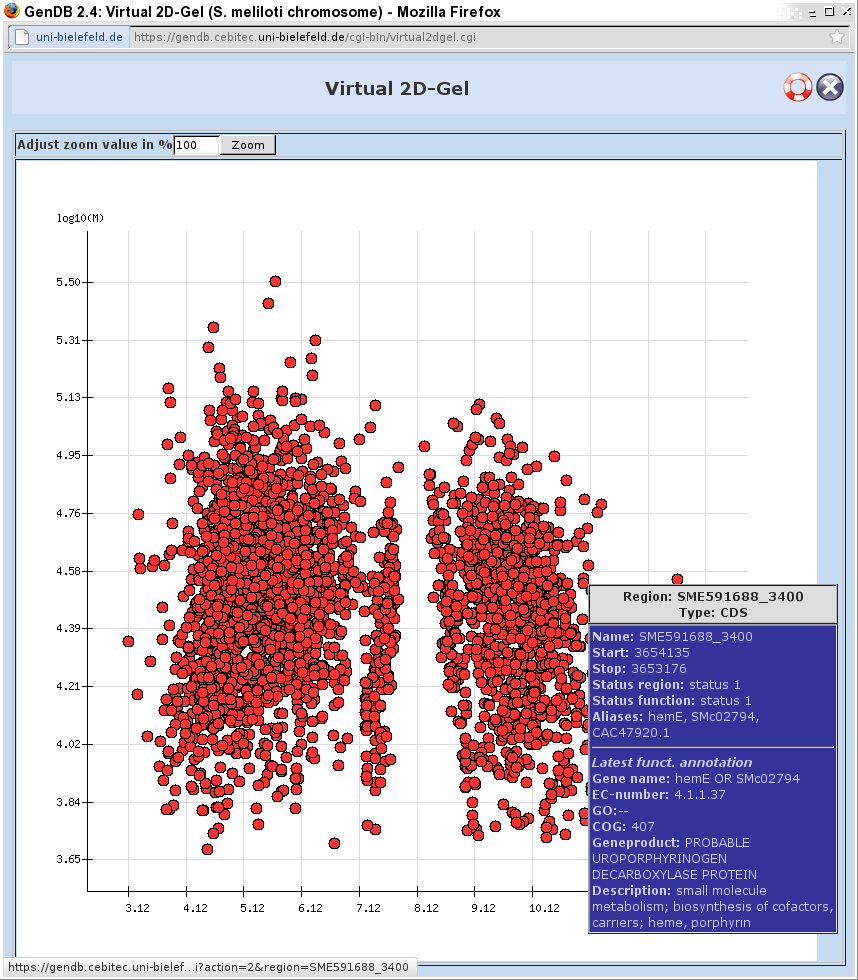
This graph depicts a virtual 2D gel based on the computed isoelectrical point over the log10 of the molecular mass. Each circle (spot) corresponds to a protein coding region of the selected contig. To display the attributes of a region simply move the mouse over a circle. All attributes are displayed in the tooltip.
