GenDBWiki/WebDocumentation/DialogWindows/ObservationDialog: Difference between revisions
(Created page with "= Observations Dialog = The Observations Dialog displays all computed tool results for a GenDB region in a table. In the first column a graphical representation of the part of t...") |
No edit summary |
||
| Line 5: | Line 5: | ||
is related to is shown. Here, every observation seen is related to the complete region. | is related to is shown. Here, every observation seen is related to the complete region. | ||
The second column contains an EValue for the observation. The EValue is available for | The second column contains an EValue for the observation. The EValue is available for | ||
every BLAST-related tool and some others like e.g. TMHMM. In the third column the | every BLAST-related tool and some others like e.g. TMHMM. In the third column the | ||
GenDB tool name for the observation is shown. The name should include the software | GenDB tool name for the observation is shown. The name should include the software | ||
tool the observation is created with and, e.g. for BLAST, the database which was | tool the observation is created with and, e.g. for BLAST, the database which was | ||
used for the observation. In the next column, there are web links to the used databases if possible. | used for the observation. In the next column, there are web links to the used databases if possible. | ||
The column 'Type' says if the tool worked on the DNA sequence or the amino acid sequence. | The column 'Type' says if the tool worked on the DNA sequence or the amino acid sequence. | ||
In the following column a description of the observation is shown. The last column | In the following column a description of the observation is shown. The last column | ||
gives the user the possibility to annotate a region using a single observation as a template or | gives the user the possibility to annotate a region using a single observation as a template or | ||
display a new popup window containing the complete tool result to have a closer look e.g. at | display a new popup window containing the complete tool result to have a closer look e.g. at | ||
the alignment of a BLAST hit. | the alignment of a BLAST hit. | ||
On top of the table there are some options about which observations should be shown and in what | On top of the table there are some options about which observations should be shown and in what | ||
order. You can sort the observations by Level, Score, Tool name, Start, Stop and Length. | order. You can sort the observations by Level, Score, Tool name, Start, Stop and Length. | ||
The sorting order can be ascending or descending. There are 5 levels the observations of each | The sorting order can be ascending or descending. There are 5 levels the observations of each | ||
tools are classified into. You can select the maximal level up to which the observations shall | tools are classified into. You can select the maximal level up to which the observations shall | ||
be shown. You can also assign a maximal number of observations you want to see, which is useful | be shown. You can also assign a maximal number of observations you want to see, which is useful | ||
if you have e.g. a slow internet connection. | if you have e.g. a slow internet connection. | ||
| Line 25: | Line 25: | ||
After changing one of the options, you must click the button 'Sort observations' to make a change. | After changing one of the options, you must click the button 'Sort observations' to make a change. | ||
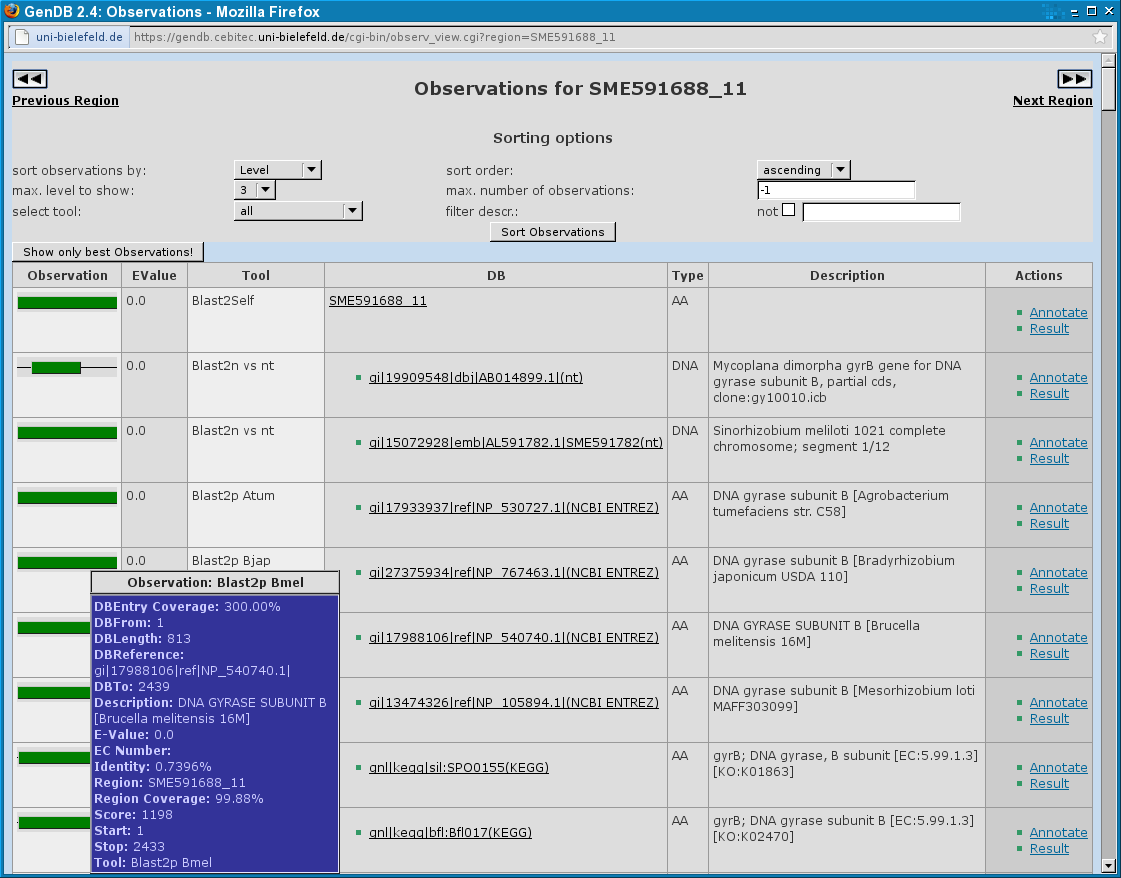
[[File:Observations.png|Screenshot of the GenDB Observations Dialog]] | |||
Latest revision as of 12:42, 22 November 2011
Observations Dialog
The Observations Dialog displays all computed tool results for a GenDB region in a table. In the first column a graphical representation of the part of the region the observation is related to is shown. Here, every observation seen is related to the complete region.
The second column contains an EValue for the observation. The EValue is available for every BLAST-related tool and some others like e.g. TMHMM. In the third column the GenDB tool name for the observation is shown. The name should include the software tool the observation is created with and, e.g. for BLAST, the database which was used for the observation. In the next column, there are web links to the used databases if possible. The column 'Type' says if the tool worked on the DNA sequence or the amino acid sequence. In the following column a description of the observation is shown. The last column gives the user the possibility to annotate a region using a single observation as a template or display a new popup window containing the complete tool result to have a closer look e.g. at the alignment of a BLAST hit.
On top of the table there are some options about which observations should be shown and in what order. You can sort the observations by Level, Score, Tool name, Start, Stop and Length. The sorting order can be ascending or descending. There are 5 levels the observations of each tools are classified into. You can select the maximal level up to which the observations shall be shown. You can also assign a maximal number of observations you want to see, which is useful if you have e.g. a slow internet connection.
After changing one of the options, you must click the button 'Sort observations' to make a change.
