MeltDBWiki/ExperimentTIC: Difference between revisions
Jump to navigation
Jump to search
imported>HeikoNeuweger No edit summary |
No edit summary |
||
| (4 intermediate revisions by 2 users not shown) | |||
| Line 12: | Line 12: | ||
* After selecting your experiment, you can generate a multiple TIC view of the associated chromatograms via the following function: | * After selecting your experiment, you can generate a multiple TIC view of the associated chromatograms via the following function: | ||
[[Image:MeltDBWiki$$ExperimentTIC$tic.png]] | |||
* The first call to this may take some time since the image needs to be rendered from the raw datasets. Consecutive calls will reuse the generated image. | * The first call to this may take some time since the image needs to be rendered from the raw datasets. Consecutive calls will reuse the generated image. | ||
[[Image:MeltDBWiki$$ExperimentTIC$tic2.png]] | [[Image:MeltDBWiki$$ExperimentTIC$tic2.png]] | ||
* The blue spots in the chromatogram visualization represent detected peaks. Additional information stored in Obseravtions and Annotations is presented for each Peak on mouse click. | |||
Latest revision as of 16:33, 31 October 2011
Review your uploaded chromatograms of your experiment
- After logging in to MeltDB, select your experiment by either a) browsing through the list of available experiments or b) via the search function available at the top.
a) 

b) 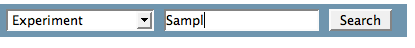
- After selecting your experiment, you can generate a multiple TIC view of the associated chromatograms via the following function:

- The first call to this may take some time since the image needs to be rendered from the raw datasets. Consecutive calls will reuse the generated image.
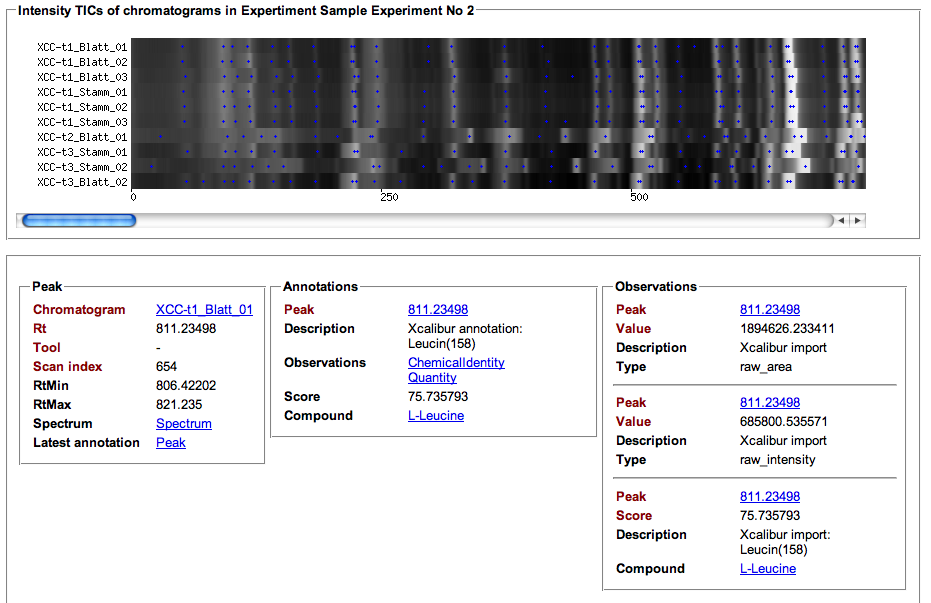

- The blue spots in the chromatogram visualization represent detected peaks. Additional information stored in Obseravtions and Annotations is presented for each Peak on mouse click.