GenDBWiki/WebDocumentation/DialogWindows/CircularPlot
Circular Plot
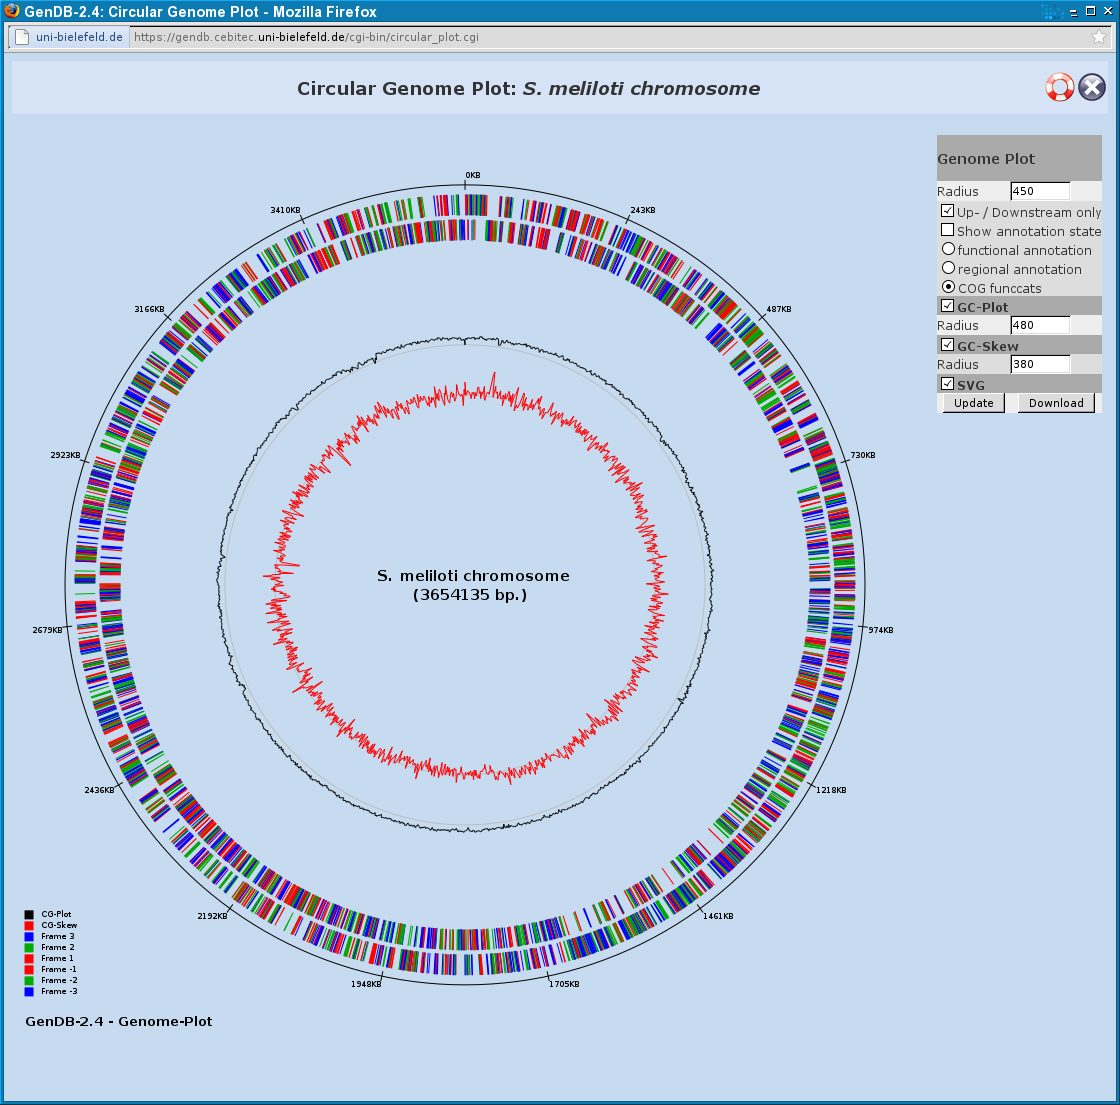
The Circular Plot shows all genes of both strands in a circular view. In this example, the colors refer to the reading frames of the regions as referred to in the legend in the lower left corner. If you click on a region, the Contig View will jump to that position.
On the upper right corner a number of options can be selected. If the checkbox 'Up- / Downstream only' is not selected, each frame will be displayed in a single circle. In this example, the box is checked, so that there is only one circle for the upstream and one for the downstream frames.
If the checkbox 'Show annotation state' is selected, the colors do not refer to the reading frame but the annotation status of the regions. Here, it can be selected if the annotation status should refer to the functional or the regional annotation (see annotation concepts).
For the circles displayed, the radius can be modified using the 'Radius' fields.
For higher graphic resolution select 'SVG' output.
